Revolutionizes data visualization with AI insights and seamless integrations.
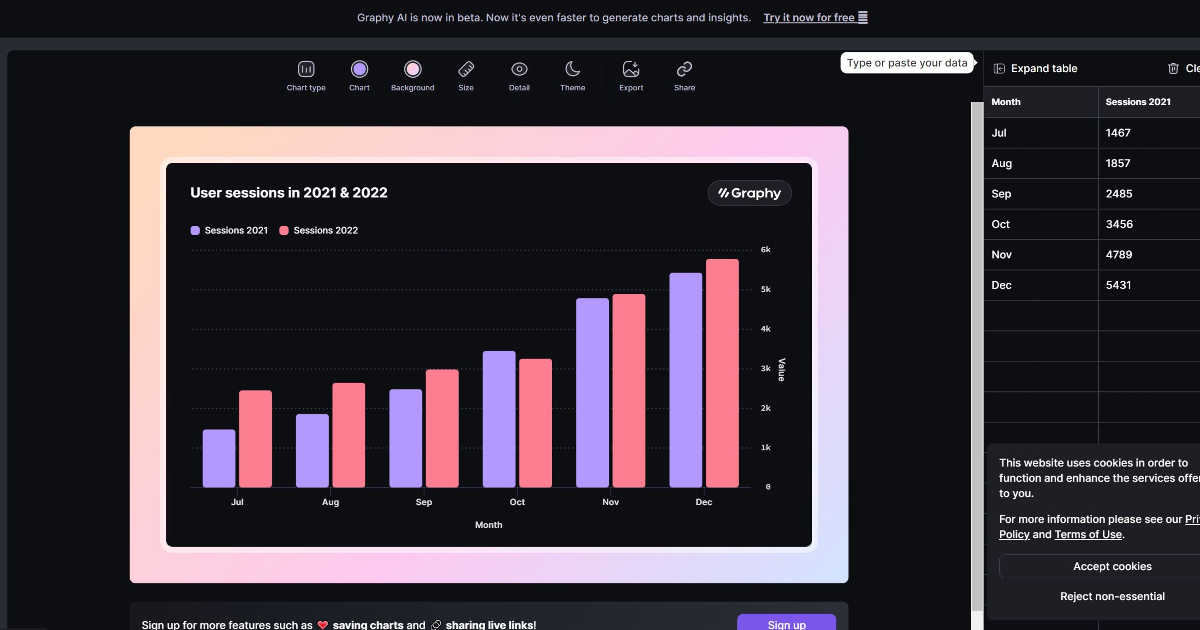
Graphy, or Graphy.app, transforms data visualization by providing advanced tools for creating professional-level graphs that drive decisions and inspire actions. It simplifies the process of presenting and communicating data, making it accessible for everyone to become skilled data storytellers. Users can create stunning, interactive graphs that not only look beautiful but also convey actionable insights. Key features include lightning-fast performance, a user-friendly interface, AI-generated insights, rich storytelling capabilities, seamless data integration with platforms like Google Sheets, and multiple sharing options across various platforms. Graphy is ideal for e-commerce businesses, digital marketing agencies, social media managers, and graphic designers, making it an essential tool for data-driven teams.
Experience Graphy with a 14-day free trial. The Pro Tier starts at $15.00 per month.
Free trial available
License: proprietary